Visualizing SQL
When you execute an SQL query with SQL magic %%sql, Jupyter notebooks initiates Qviz framework and the query data is displayed in the table format.
You can select any other visualization type to view the data.
Note
The display() function is supported only on PySpark, Spark, and SparkR kernels. The Qviz framework supports 1000 rows and 100 columns.
Example:
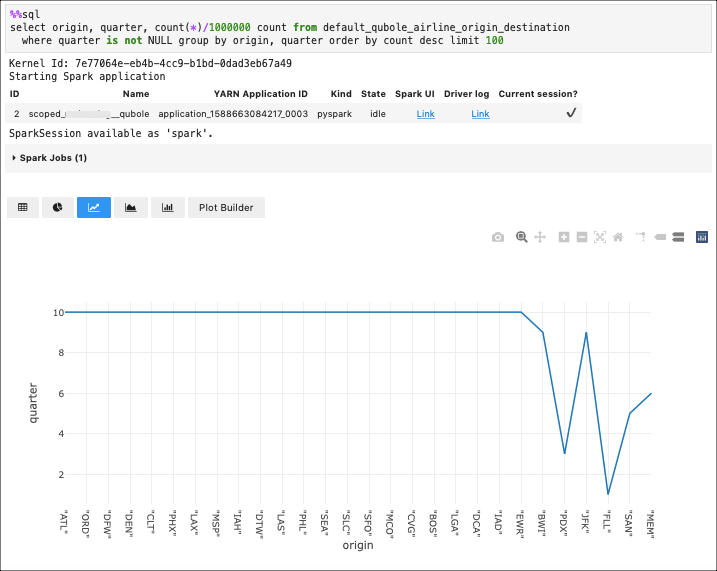
%%sql
select origin, quarter, count(*)/1000000 count from default_qubole_airline_origin_destination
  where quarter is not NULL group by origin, quarter order by count desc limit 100
The following image shows a sample SQL visualization in Line chart.
You can click on the other chart options in the Qviz framework to view other visualization types and customize the chart by using the Plot Builder option. For more information, see Using Qviz Options.