Visualizing pandas dataframes
You can visualize a pandas dataframe in Jupyter notebooks by using the display(<dataframe-name>) function.
Note
The display() function is supported only on PySpark kernels. The Qviz framework supports 1000 rows and 100 columns.
For example, you have a pandas dataframe df that reads a .csv file. You can visualize
the content of this pandas dataframe by using the display(df) function as show below:
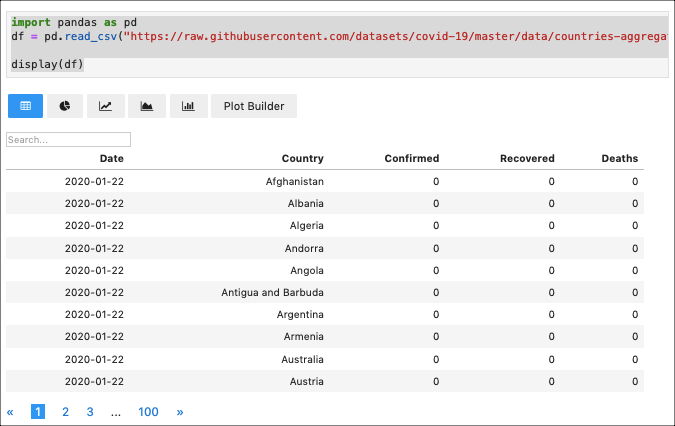
By default, the dataframe is visualized as a table.
The following image shows the sample visualization chart of display(df).
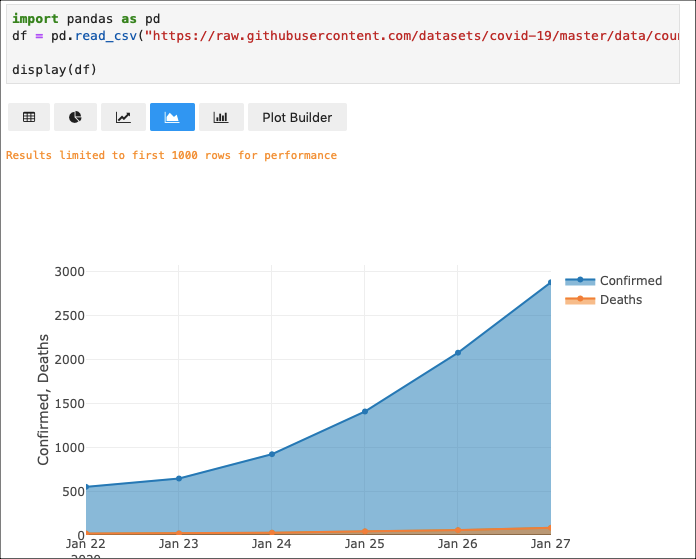
You can click on the other chart options in the Qviz framework to view other visualization types and customize the chart by using the Plot Builder option. For more information, see Using Qviz Options.
The following image shows the Area chart of the above mentioned pandas dataframe.