Creating Jupyter Notebooks
You can create Jupyter notebooks with PySpark(Python), Spark(Scala), and SparkR Kernels from the JupyterLab interface.
Perform one of the following steps to create a Jupyter notebook.
From the Launcher, click on PySpark, Spark, SparkR, or Python to create a Jupyter notebook with PySpark, Spark, SparkR, or Python Kernels, respectively.
Note
Python kernel does not use the distributed processing capabilities of Spark when executed on a Spark cluster.
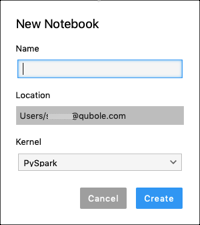
Navigate to the File >> New menu and select Notebook. The New Notebook dialog is displayed as shown below.

Enter a name for the Jupyter notebook.
Select the appropriate Kernel from the drop-down list.
Click Create.
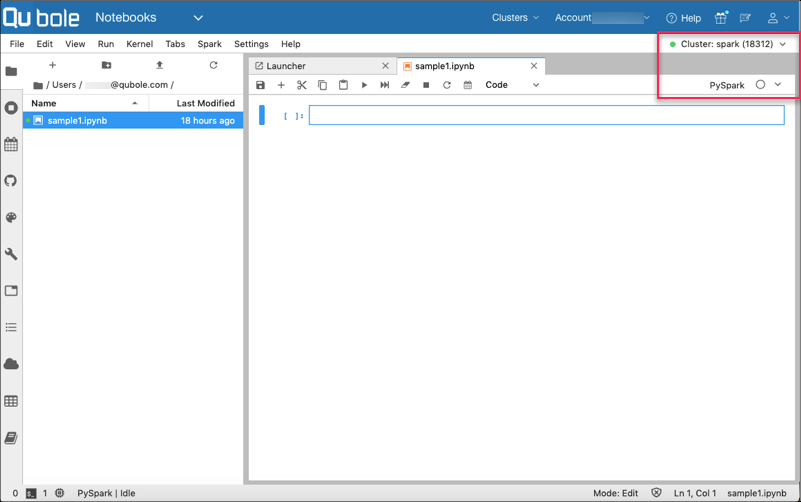
The newly created Jupyter notebook opens in the main work area as shown in the following figure.

The new Jupyter notebook has the following UI options:
- Associated cluster on the top-right corner.
To change the associated cluster perform the following steps:
- Click on the down arrow and select the required cluster. If you select a cluster that is not running, then initial UI of the JupyterLab interface is opened.
- Select the required cluster, and click Open.
- Associated Kernel. The empty circle indicates an idle kernel. The circle with the cross bar indicates a disconnected kernel, and a filled circle indicates a busy kernel.
- The widget shown as down arrow displays the Spark application status.
- Various buttons in the toolbar to perform operations on that notebook.
- Context menus that are displayed with a right-click on the UI elements. In the Main Work Area, you can perform cell-level and notebook-level operations by using the context menu of the Main Work Area. For details, see Context Menu for Main Work Area.
The following magic help you build and run the code in the Jupyter notebooks:
%%helpshows the supported magics.%%markdownfor markdown or select “Markdown” from Cell type drop-down list.%%sqlfor sql on spark.%%bash or %%shfor shell.%%localfor execution in kernel.%%configurefor configuring Spark settings.%matplot pltinstead of%%localfor matplots.