Publishing Dashboards
Publishing a dashboard involves creating and sharing a report view (read-and-execute-only) of a notebook. The resulting dashboard can be run by users (consumers) who do not have to be owners of the QDS account. Once you have shared the dashboard, you can continue to develop the underlying notebook without affecting the dashboard. Conversely, consumers can change the dashboard parameter values, and re-run the dashboard and save the results, without affecting the notebook.
Note
Ensure that you have permissions to the Folder resource as described in Resources, Actions, and What they Mean.
If you as the associated notebook owner make changes to the notebook that you want to share, you can republish the dashboard, under either the same or a different name. If you use a different name, the original dashboard remains intact; otherwise it is overwritten.
If you delete the notebook, the dashboard will continue to exist, but it is best to delete it unless you have some good reason for keeping it, as it will quickly become out of date.
If you move the notebook to a new cluster, you will need to make any changes to the interpreters that are needed to make the dashboard run correctly, attach the interpreters to the notebook, and republish the dashboard.
Publishing a Dashboard
You must be a owner of a QDS account or a user with Create permission to publish a dashboard.
Note
Ensure that you have permissions to the Folder resource as described in Resources, Actions, and What they Mean.
Proceed as follows:
From the main menu of the QDS UI, navigate to Notebooks.
Click on a notebook to open it.
Click the Dashboards icon near the top right of the screen and you can see Create Dashboard as shown here.
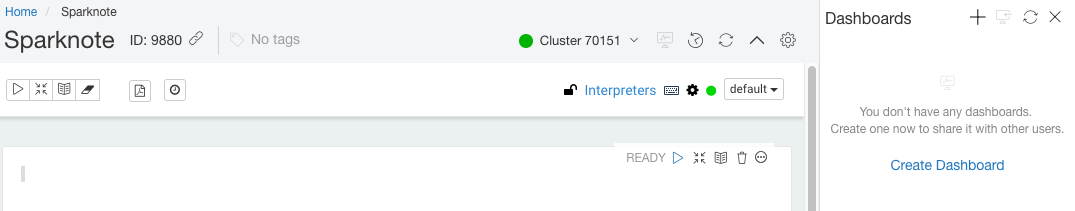
Click Create Dashboard or the + sign and the resulting screen is a dialog as shown here.
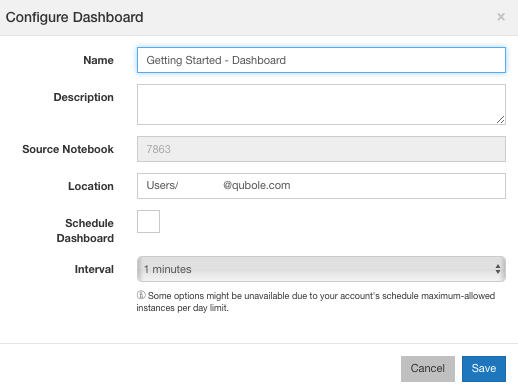
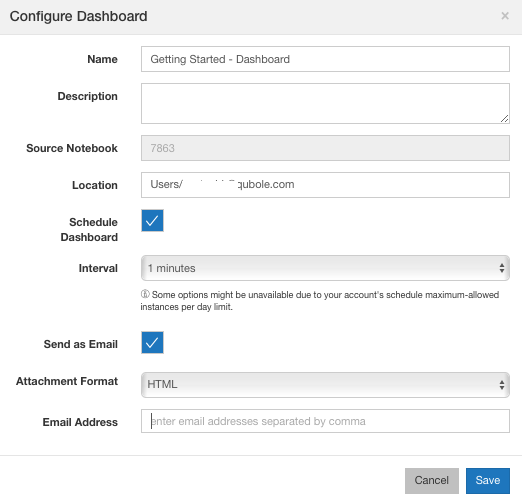
Provide a name for the dashboard and choose a location from the dropdown (browse to any of the location using the location picker). The location can be:
- My Home (your own folder)
- Users (choose a user from the dropdown)
- Common
Note
To create a dashboard in a folder other than My Home, you must have write permission to that folder.
Optionally add a description.
Select Schedule Dashboard if you want to refresh the dashboards at regular intervals. The Interval field gets enabled once you select Schedule Dashboard as shown here.
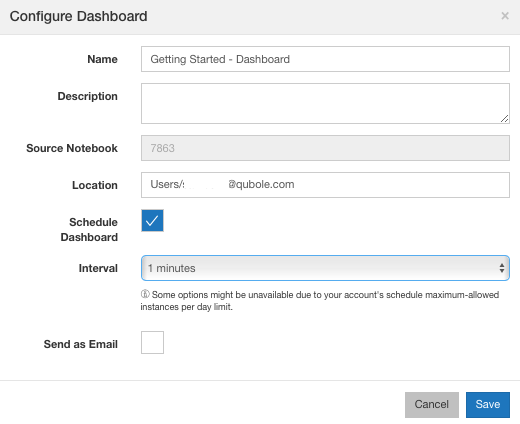
The default time interval displayed is based on the Maximum Instances per day set for a specific account in the account’s limits. To change it, select any value from the Interval drop-down list.
Note
For a scheduled Spark dashboard, the associated interpreters are stopped after the completion of the scheduled run.
If you selected Schedule Dashboard and if you want to subscribe to emails that contain the dashboard report at every dashboard refresh, perform the following steps:
- Select the Send as Email option.
- Select the appropriate format from the Attachment Format drop-down list. By default, HTML is selected.
- Enter the email address and click Save.
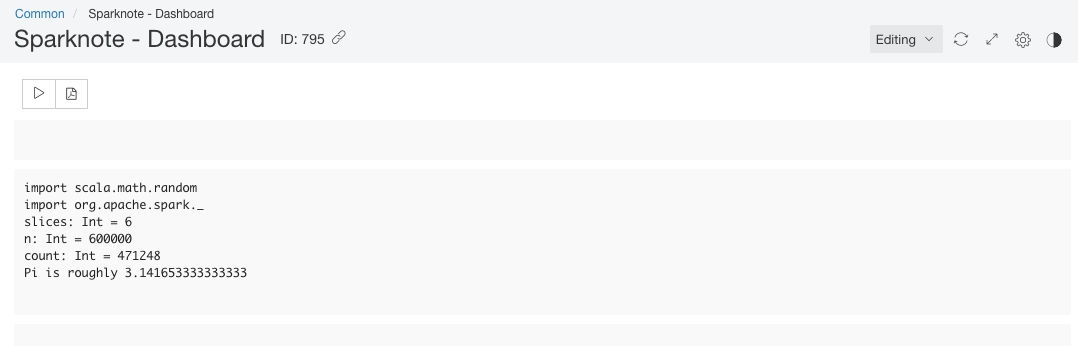
The new dashboard appears on the right panel of the screen as shown here.
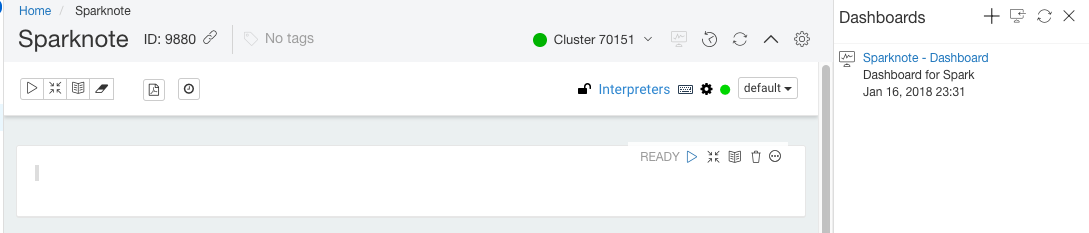
You can just click the dashboard or navigate to Dashboards to see the dashboard that you have published as shown here.
Understanding the Different Dashboard Modes
By default the dashboard is in a Read-only (compute is DOWN) or in an Editing (compute is UP) mode.
The associated notebook owner can see the dashboard in the Editing mode if the compute is UP. Pull down the Editing mode drop-down list and you can see Enable Interactive Mode which enables you to go into personalized view. The Interactive Mode lets you create a personalized view where you (or any user) can change the paragraph parameters (if any) and see a different result than the actual dashboard.
You (or any user) must have an Execute permission to enter into the Interactive Mode.
Managing Dashboard Permissions
Only the associated notebook owner or user with Manage permission can set Dashboard permissions that are described below.
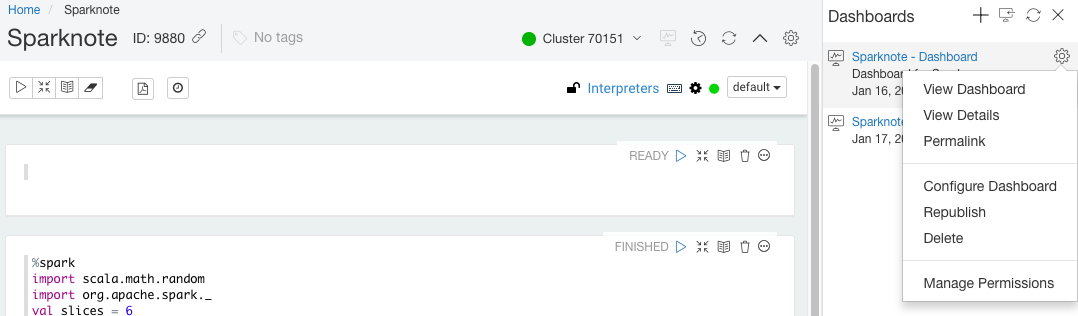
To set permissions, click the gear icon and you can see the various options as shown here:
Choose Manage permissions , then choose a user or group from the drop-down. By default, each user who is a system-admin of a QDS account, and each group comprising such members, has all capabilities (read, update, delete, execute, and manage); keep in mind that these relate to the dashboard, not to the underlying notebook. You can adjust the permissions as you see fit. Here is an example of how permissions are set to two different users.
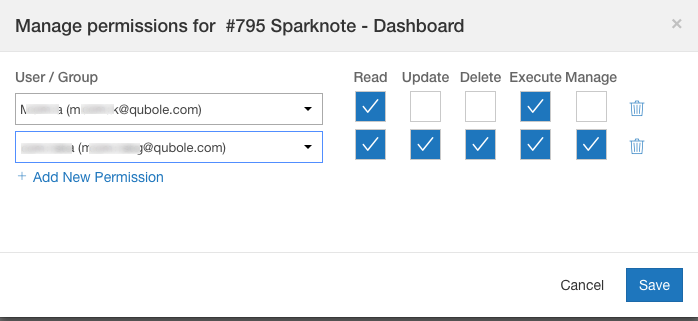
You can assign permission to a user or a group. Click Add Permission to assign permission to another user/group.
While selecting a user/group in the drop-down list, a user is displayed with the <username> (<email-address>) and a
group is displayed with just the <group name>.
Configuring Dashboards
You (as the associated notebook owner) can configure dashboards and a user who has Update permission can also configure dashboards. Click the gear icon against the dashboard in the left panel or in the top-left corner of the dashboard. From the options displayed, click Configure Dashboard. The Configure Dashboard dialog is displayed as shown here.
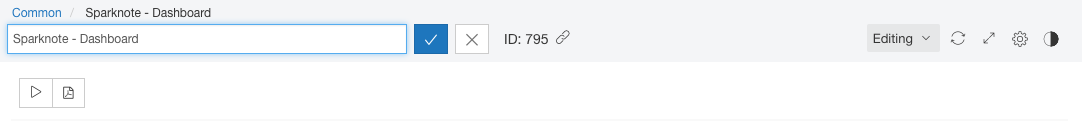
You can edit the periodic-refresh interval and any other fields except the source. You can also edit the dashboard name by clicking its name in the header as shown here.
You can optionally subscribe to emails that contain the dashboard report at every dashboard refresh by selecting the Send as Email option as shown below. The report can be in one of the following formats: PDF, PNG, or HTML.
Changing the Dashboard Color Theme
A QDS user with Update permission can change the theme of the dashboard. The half black-and-white circle icon
in the top-left of the dashboard lets you do that. The icon is as illustrated here.
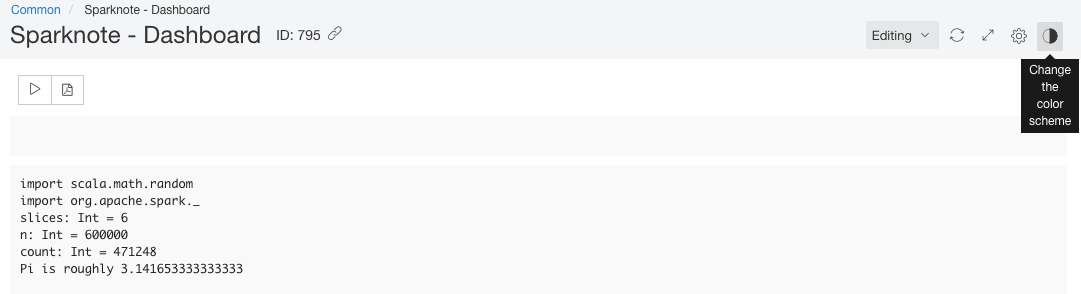
Click the theme icon and you can see different themes. Choose the one that you want to use and the new theme immediately gets applied on to the dashboard.
Creating and Managing Dashboard Folders
You can only create single-level folders on Dashboards UI to organize the dashboards.
In the left-side panel of Dashboards, there is a new folder icon on the top. Click it to create a new folder. The dialog to create a folder is displayed as shown here.
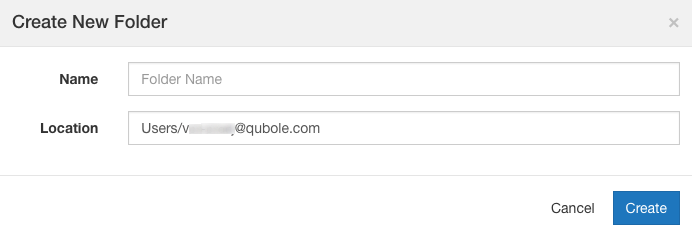
Add a name to the folder. By default the location will be in the Users/<user-emailaddress>. Change it to a different location if you want a non-default location.
After you create the folder, you can refresh, rename, move, or delete it. To do, click the gear icon against that folder and select it. The dashboard folder operations are described below:
To refresh a folder, click the gear icon against the dashboard folder that you want to refresh. Click Refresh from the drop-down list.
To rename a folder, click the gear icon against the dashboard folder that you want to rename. Click Rename from the drop-down list. The dialog is displayed as shown here.
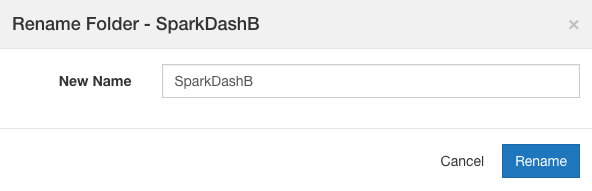
Add a new name to the folder and click Rename.
To move a folder, click the gear icon against the dashboard folder that you want to move. Click Move from the drop-down list. The dialog is displayed as shown here.
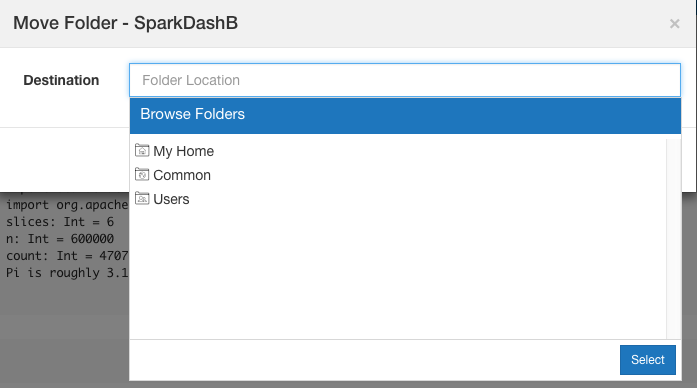
Add a path to the folder in Destination or browse to the new location and click Move.
To delete a folder, click the gear icon against the dashboard folder that you want to delete. Click Delete from the drop-down list.
A dialog is displayed that asks for confirmation for deleting the folder. Click OK to delete it.