Monitoring an Airflow Cluster
You can monitor an Airflow cluster by using the Airflow Web Server and Celery Web Server. The web server URLs are available in the Resources column of a running Airflow cluster.
Qubole supports monit within an Airflow cluster to monitor and automatically start the Webserver, Rabbitmq, and Celery services in case of a failure.
Monitoring through Airflow Web Server
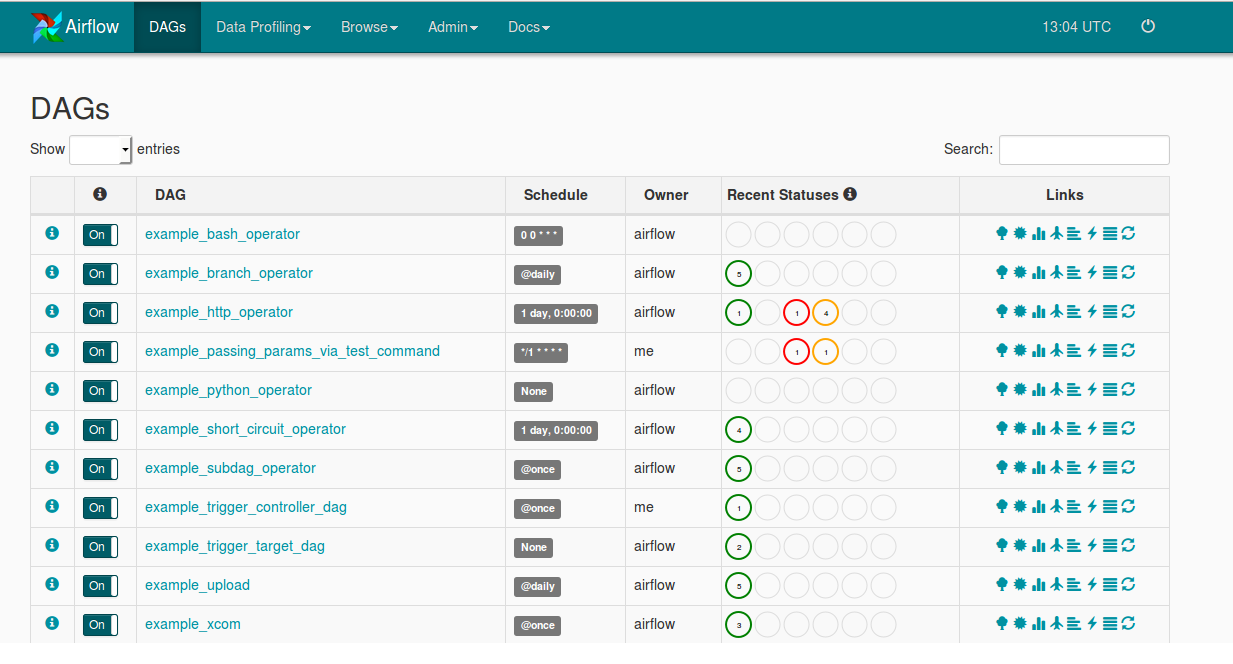
In the Clusters tab, from the cluster Resources of a running Airflow cluster, click Airflow Web Server. The Airflow Web Server is displayed as shown in the following illustration.
Click the Qubole Operator DAG as shown in the following figure.
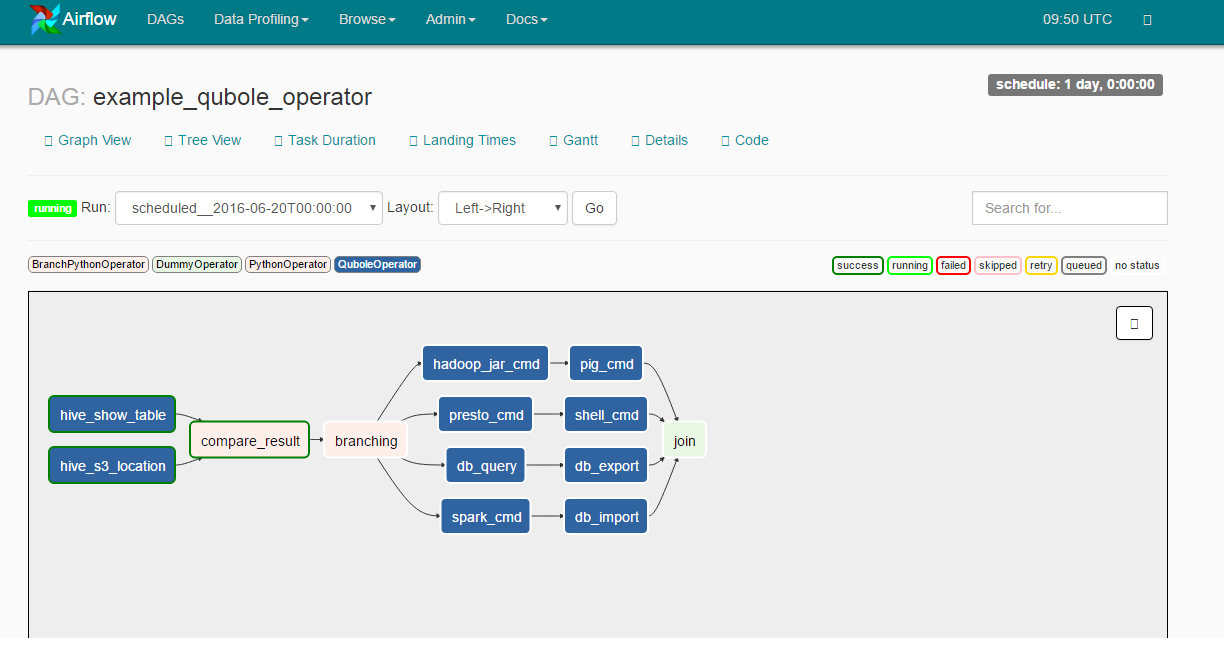
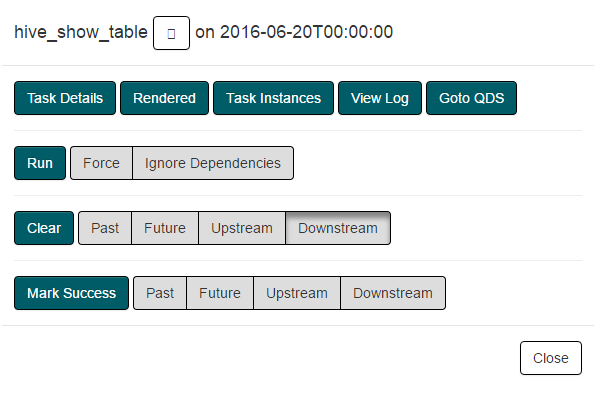
Click a command from the chart and you can see the link, Goto QDS as shown in the following figure.
Qubole Operator tasks are linked with a QDS command. Following features are available to facilitate linking:
- Goto QDS: An external link pointing to corresponding to QDS command while visualizing Qubole Operator tasks of a DAG run in the web server.
- Filtering Airflow QDS Commands: Any QDS command triggered through the Airflow cluster contains three tags:
dag_id,task_id,run_id. These can be used to filter QDS commands triggered from Airflow at various levels (dag/task/particular execution).
Monitoring through the Celery Dashboard
In the Clusters tab, from the cluster Resources of a running Airflow cluster, click Celery Dashboard to monitor the Celery workers. The Celery server runs on the 5555 port.
Monitoring through Ganglia Metrics
When Ganglia Metrics is enabled, you can see the Ganglia Metrics URL from the cluster Resources of a running Airflow cluster. The dashboard shows system metrics such as CPU and disk usage.
Monitoring through Logs
You can monitor an Airflow cluster using the following types of logs:
- Airflow logs: Airflow DAG logs are now moved to
/media/ephemeral0/logs/airflow/dags, and a symlink is created to the old location, which is$AIRFLOW_HOME/logs. As a result, the local disk space is not consumed by the logs. - Airflow services logs: Logs for services such as scheduler, webserver, Celery, and so on are under /media/ephemeral0/logs/airflow.
- Airflow logs (remote): All Airflow logs are uploaded to the remote storage location provided in the account. These logs can be found
at
<default location>/airflow/<cluster-id>/dag_logs/and<default location>/airflow/<cluster-id>/process_logs/<cluster_inst_id>/.
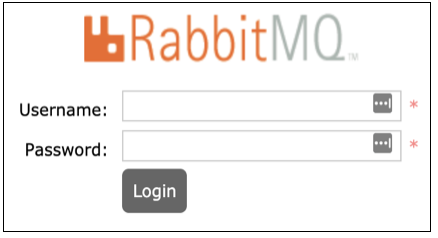
Monitoring through RabbitMQ Dashboard
You can monitor an Airflow cluster through the RabbitMQ dashboard. To use RabbitMQ dashboard, run the following shell command on the Analyze page to create a new user.
sudo /usr/sbin/rabbitmqctl add_user new_user new_password;
sudo /usr/sbin/rabbitmqctl set_user_tags new_user administrator;
sudo /usr/sbin/rabbitmqctl set_permissions -p / new_user ".*" ".*" ".*"
After you create the username and password, you can log in to RabbitMQ dashboard with the newly created credentials (username and password) on the login page.