Accessing the Spark Logs
When a Spark job or application fails, you can use the Spark logs to analyze the failures.
The QDS UI provides links to the logs in the Application UI and Spark Application UI.
- If you are running the Spark job or application from the Workbench page, you can access the logs via the Application UI and Spark Application UI.
- If you are running the Spark job or application from the Notebooks page, you can access the logs via the Spark Application UI.
You can also additional logs to identify the errors and exceptions in Spark job or application failures.
Accessing the Application UI
To access the logs via the Application UI from the Workbench page of the QDS UI:
- Note the command id, which is unique to the Qubole job or command.
- Click on the down arrow on the right of the search bar.
The Search History page appears.
Enter the command id in the Command Id field and click Apply.
Logs of any Spark job are displayed in Application UI and Spark Application UI, which are accessible in the Logs and Resources tabs. The information in these UIs can be used to trace any information related to command status.
The following figure shows an example of Logs tab with links.
Click on the Application UI hyperlink in the Logs tab or Resources tab.
The Hadoop MR application UI is displayed as shown in the following figure.
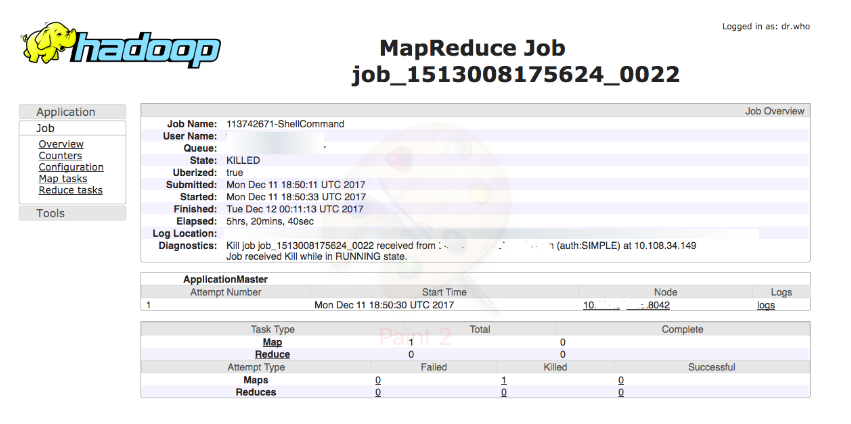
The Hadoop MR application UI displays the following information:
- MR application master logs
- Total Mapper/Reducer tasks
- Completed/Failed/Killed/Successful tasks
Note
The MR application master logs corresponds to the Spark driver logs. For any Spark driver related issues, you should verify the AM logs (driver logs).
If you want to check the exceptions of the failed jobs, you can click on the logs link in the Hadoop MR application UI page. The Application Master (AM) logs page that contains stdout, stderr and syslog is displayed.
Accessing the Spark Application UI
You can access the logs by using the Spark Application UI from the Workbench and Notebooks pages.
From the Workbench page
- From the Home menu, navigate to the Workbench page.
- Note the command id, which is unique to the Qubole job or command.
- Click on the down arrow on the right of the search bar. The Search History page appears as shown in the following figure.
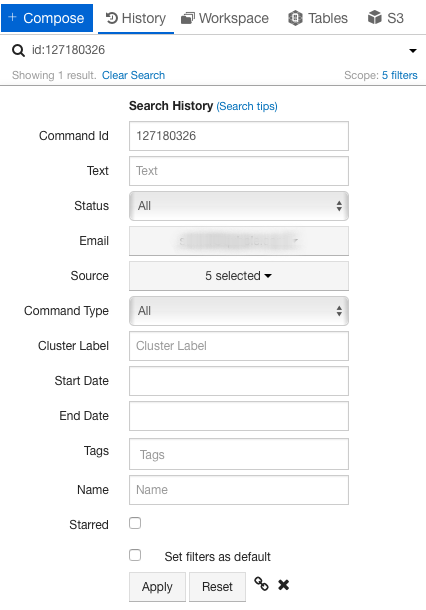
- Enter the command id in the Command Id field and click Apply.
- Click on the Logs tab or Resources tab.
- Click on the Spark Application UI hyperlink.
From the Notebooks page
From the Home menu, navigate to the Notebooks page.
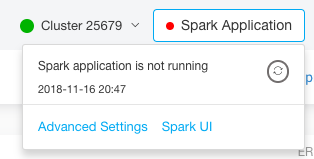
Click on the Spark widget on the top right and click on Spark UI as shown in the following figure.
OR
Click on the i icon in the paragraph as shown in the following figure.
When you open the Spark UI from the Spark widget of the Notebooks page or from the Analyze page, the Spark Application UI is displayed in a separate tab as shown in the following figure.
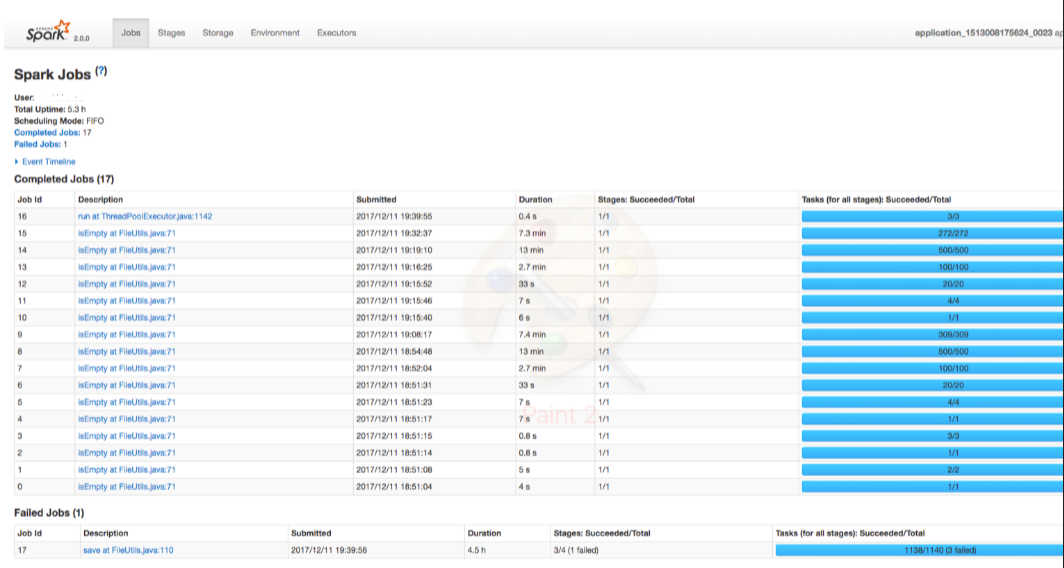
The Spark Application UI displays the following information:
Jobs: The Jobs tab shows the total number of completed, succeeded and failed jobs. It also shows the number of stages that a job has succeeded.
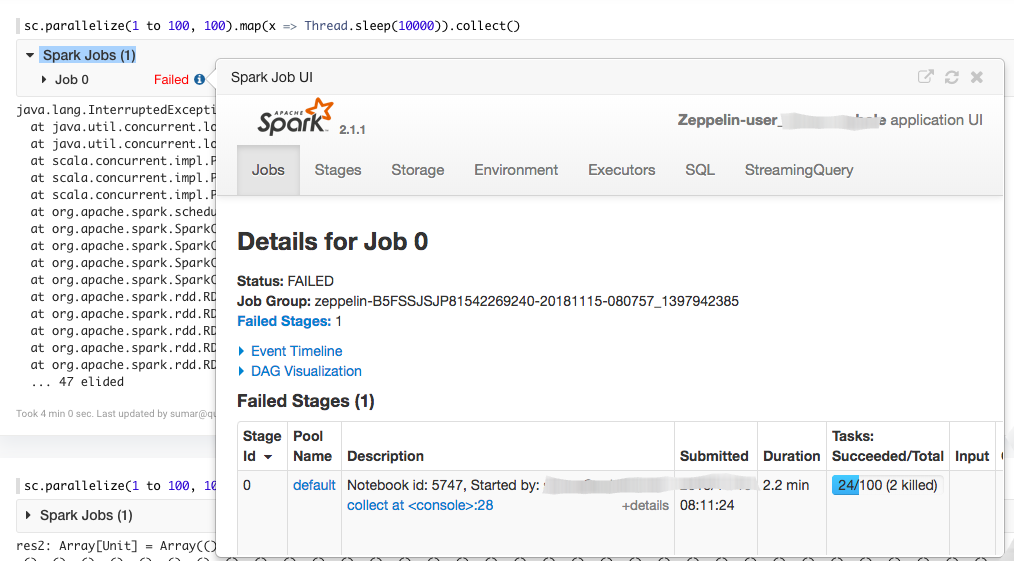
Stages: The Stages tab shows the total number of completed and failed stages. If you want to check more details about the failed stages, click on the failed stage in the Description column. The details of the failed stages are displayed as shown in the following figure.
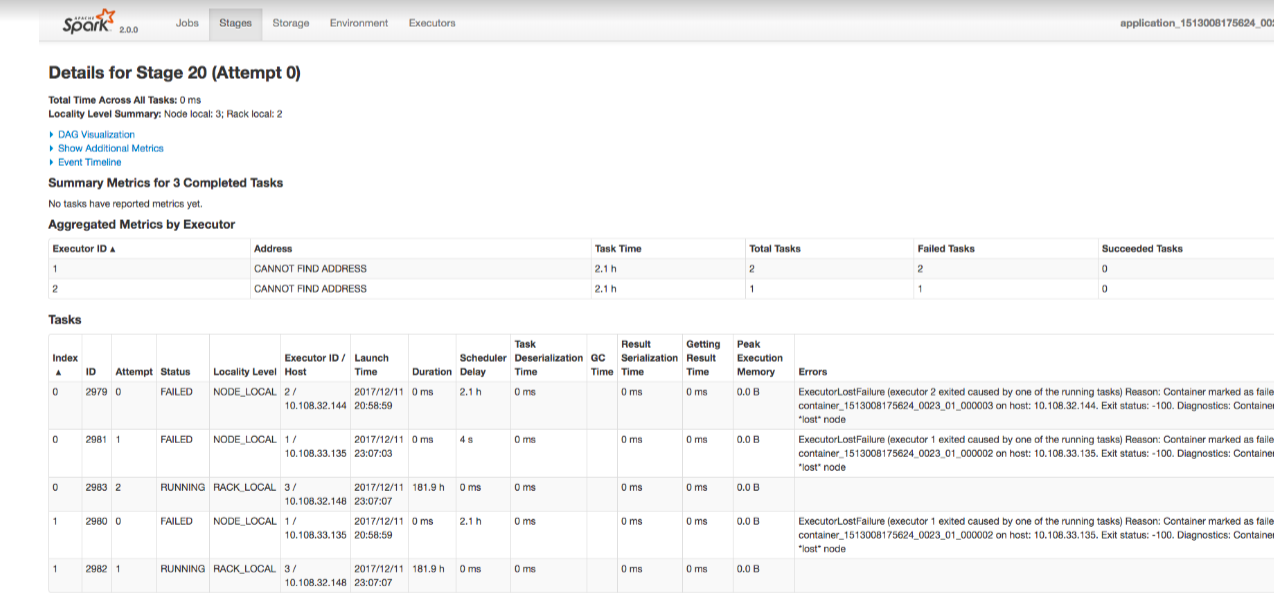
The Errors column shows the detailed error message for the failed tasks. You should note the executor id and the hostname to view details in the container logs. For more details about the error stack trace, you should check the container logs.
Storage: The Storage tab displayed the cached data if caching is enabled.
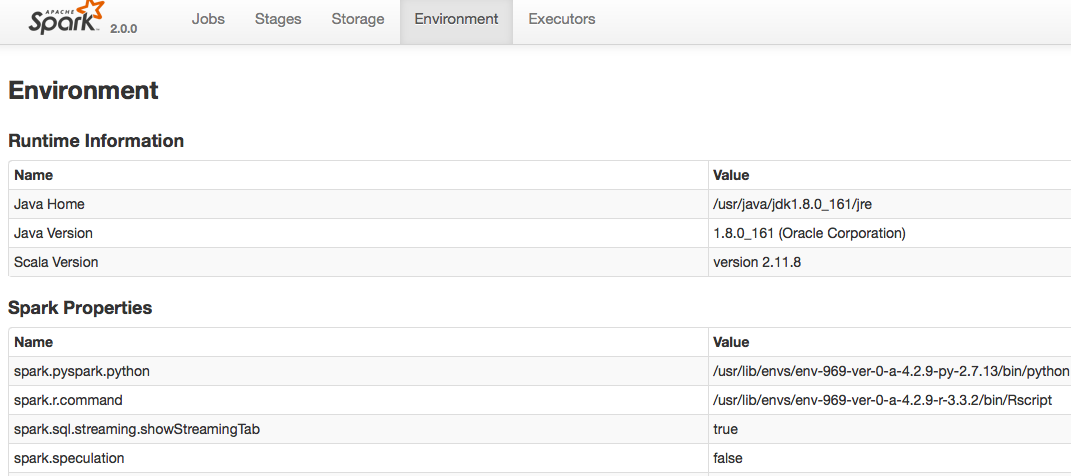
Environment : The Environment tab shows the information about JVM, Spark properties, System properties and classpath entries which helps to know the values for a property that is used by the spark cluster during runtime. The following figure shows the Environment tab.
Executors : The Executors tab shows the container logs. You can map the container logs using the executor id and the hostname, which is displayed in the Stages tab.
Spark on Qubole provides the following additional fields in the Executors tab:
- Resident size/Container size: Displays the total physical memory used within the container (which is the executor’s java heap + off heap memory) as Resident size, and the configured yarn container size (which is executor memory + executor overhead) as Container size.
- Heap used/committed/max: Displays values corresponding to the executor’s java heap.
The following figure shows the Executors tab.
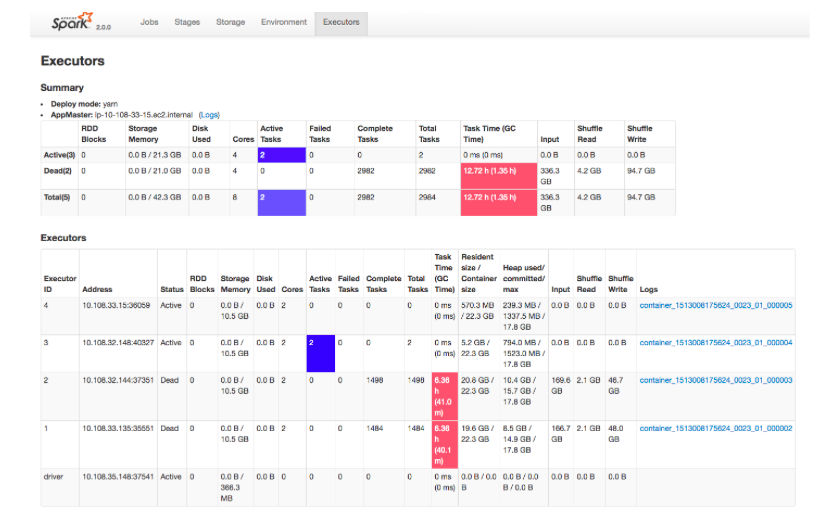
The Logs column in shows the links to the container logs. Additionally, the number of tasks executed by each executor with number of active, failed, completed and total tasks are displayed.
Note
For debugging container memory issues, you can check the statistics on container size, Heap used, the input size, and shuffle read/write.